The Vulcan Cyber risk management platform is used to identify and prioritize vulnerabilities in an organization’s environment so they can focus on remediating or mitigating the most-pressing threats first. While traditional vulnerability prioritization tools were serviceable during a simpler time, vulnerability management teams need a modern platform built to handle cloud-scale, multiple interconnected attack surfaces, and tens of thousands of threats and vulnerabilities. These days, there is much more to the picture than meets the eye.
Vulcan Cyber already takes risk management to the next level by placing vulnerabilities in context within the environment, adapting the ratings provided by common sources, including threat intelligence feeds and the vulnerability scanners themselves.
But what if you could get even more granular and relevant, and measure risk more accurately than ever before? What if you could not only see vulnerabilities in context but could also understand the full network impact of a breach, seeing vulnerabilities how a threat actor would see them.
Now you can.
Connecting the dots
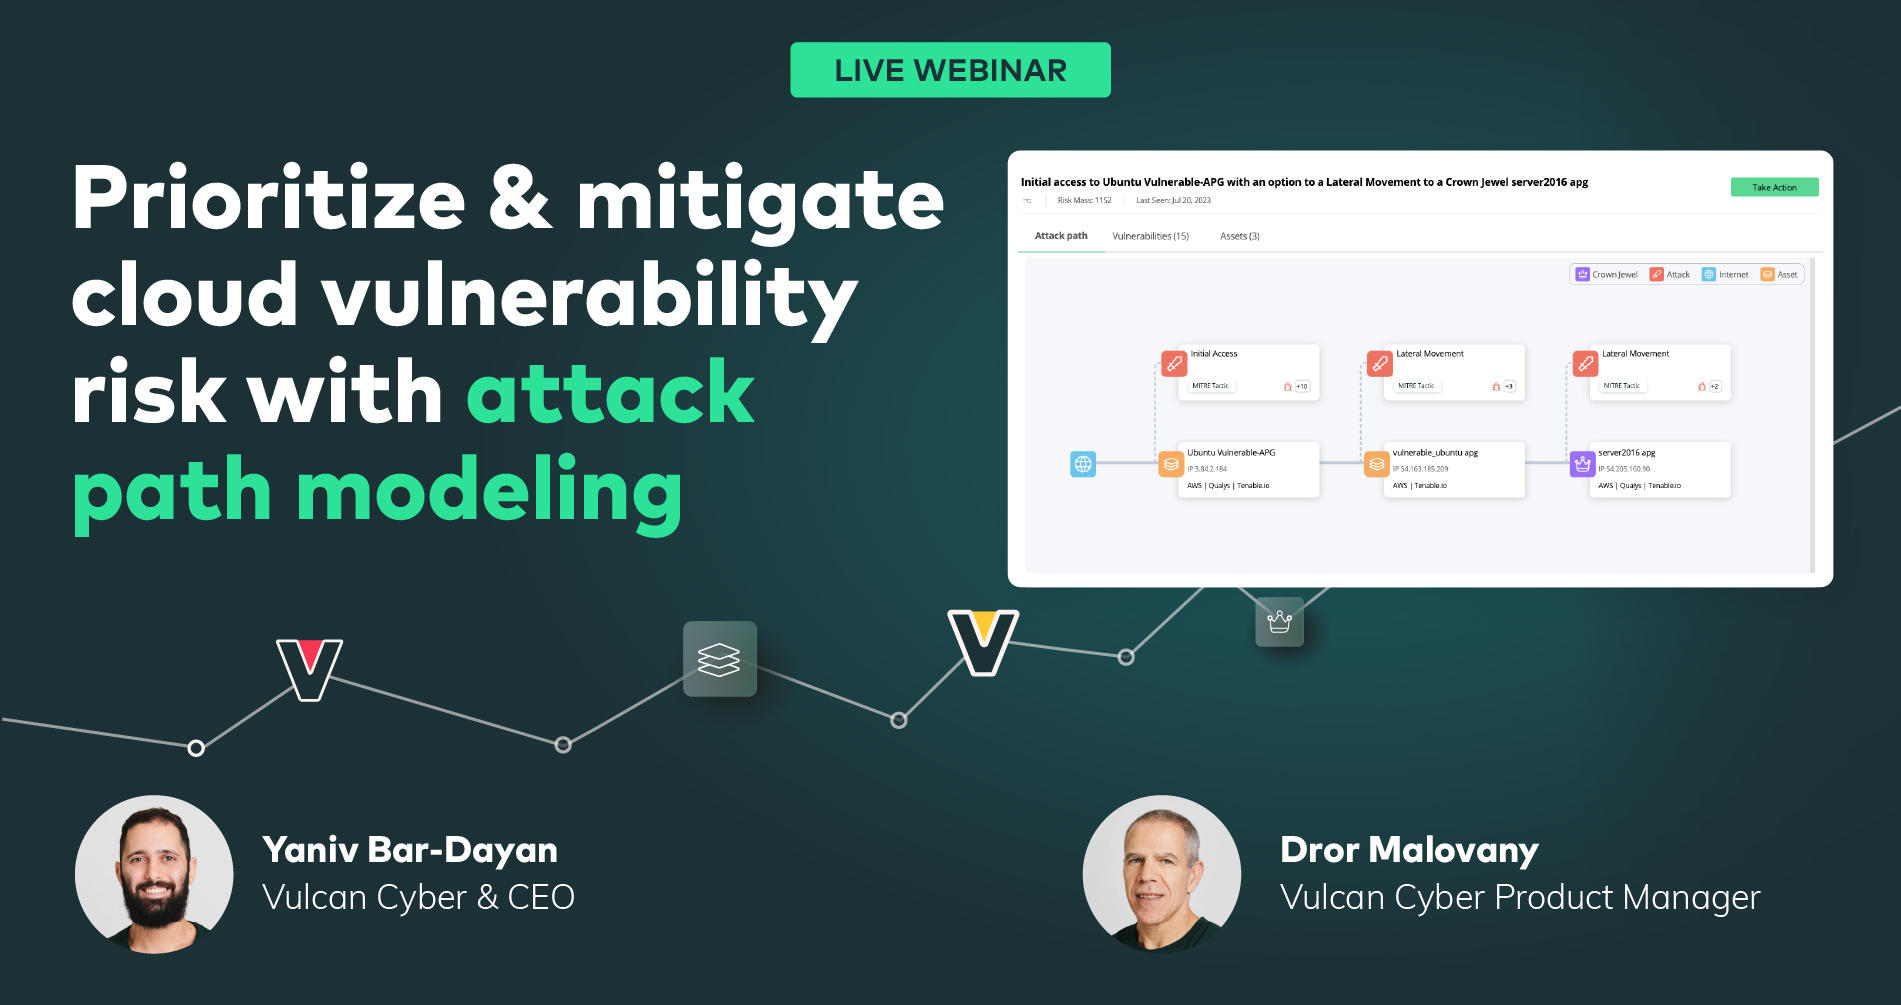
Vulcan Cyber Attack Path Graph is new functionality, now available in private beta, that helps enterprise vulnerability management teams visualize how vulnerable, interconnected hosts can lead an attacker from the vulnerable edge, compromised assets, deeper into the environment gaining access to desired targets.
Attack Path Graph lets you see how an attacker could compromise an asset somewhere in the environment, then move laterally via connected assets to reach the organization’s crown jewels.
Functionally, this delivers a graphical representation of both the vulnerable hosts and the techniques an attacker could exploit to reach their target assets. Attack Path Graph enhances the context Vulcan Cyber already provides and does it intuitively. Where Vulcan Cyber is already providing contextualized prioritization, this new representation makes visualizing the potential impact much easier, making it possible to see how a minor vulnerability can be much more of a risk than previously realized.
For many vulnerability analysts or asset owners, a graphical representation like this is more effective than traditional, common vulnerability risk prioritization methods. We have always used context in the environment to help prioritize risk, but Attack Path Graph shows risk in context.
A core feature of the APG Attack Path Graph functionality is the concept of the “Crown Jewels” tag which is an easy way for teams to highlight the most important assets within an organization. Attack Path Graph lets you visually trace the route from a potential attacker’s initial access across vulnerable hosts to the most valuable assets in your environment. By leveraging Vulcan Cyber custom tagging capability, it’s easy to assign a tag that will identify a given asset as a top priority and have it mapped visually on the attack path.
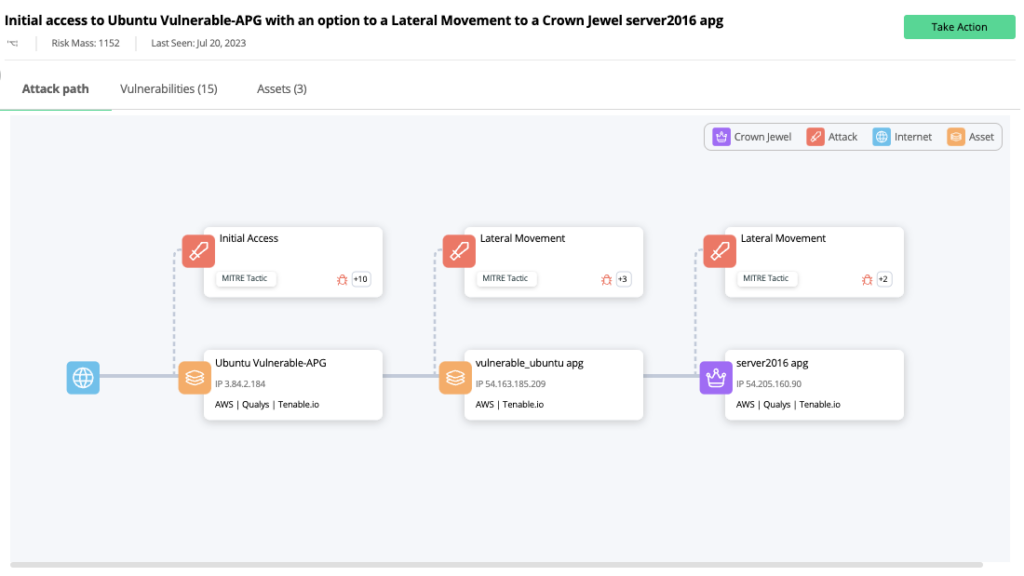
Another aspect of this new feature is the ability to see which MITRE ATT&CK tactics an attacker would use to move to the next step, and highlights specific asset vulnerabilities in play.
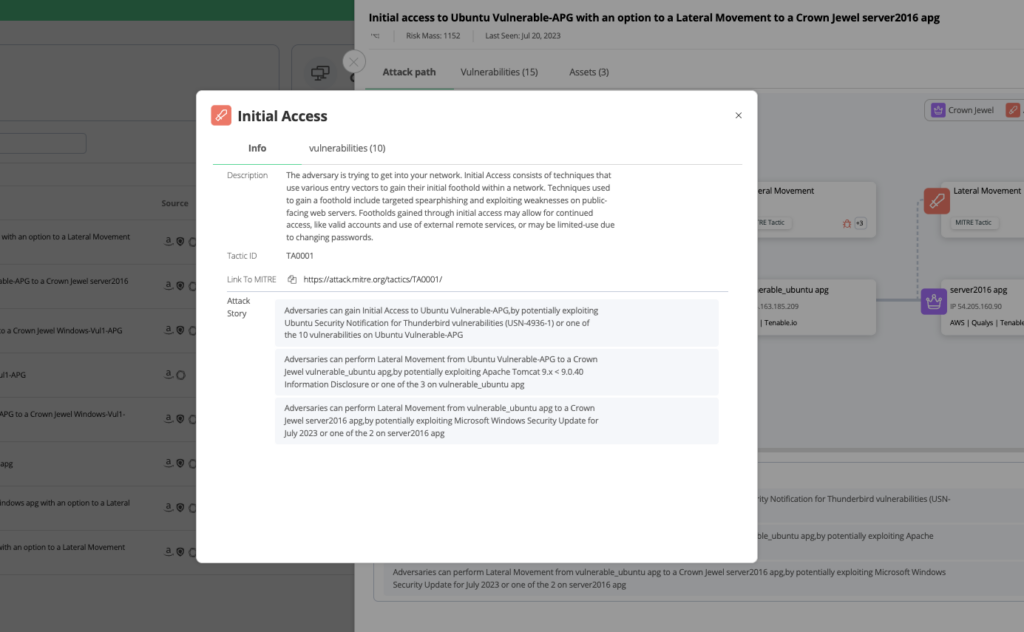
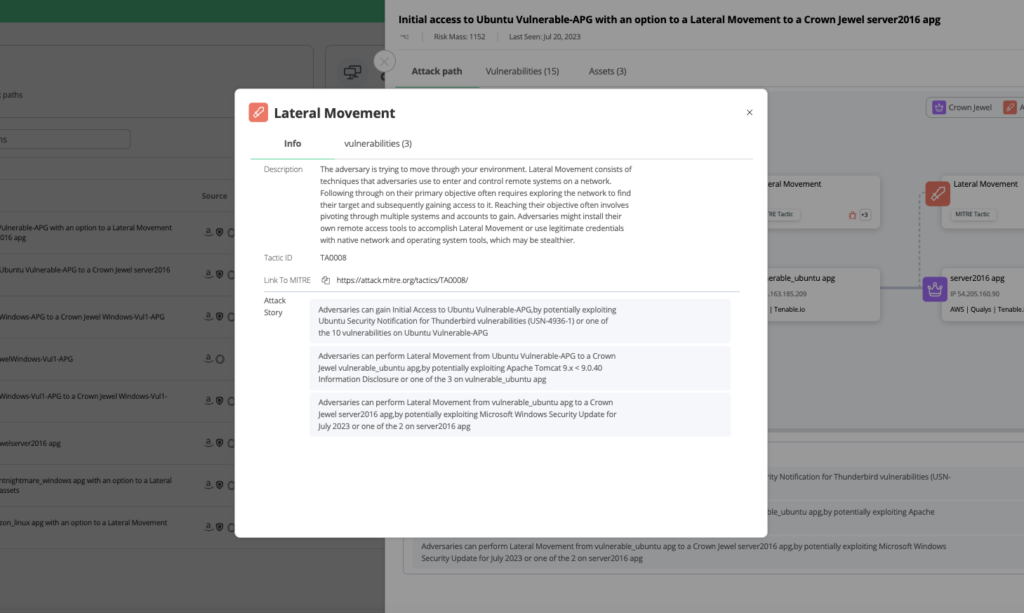
The new Attack Path Graph panel shares interactions with other parts of the Vulcan Cyber platform, letting you easily take action to mitigate risk, or drill deeper for more information on the impacted assets and the vulnerabilities found on them. And, of course, Vulcan Cyber automates and orchestrates remediation and mitigation steps needed to reduce risk prioritized on the Attack Path Graph.
Watch the on-demand session >>
Under the hood
Under the hood, the Attack Path Graph functionality leverages the comprehensive risk data collected by Vulcan Cyber from vulnerability scanners and asset management tools to build a topographic view of the customer’s environment. It incorporates the connections, dependencies and relationships between hosts, applications, code projects, etc., to map out where an attacker could potentially breach the environment and access critical infrastructure.
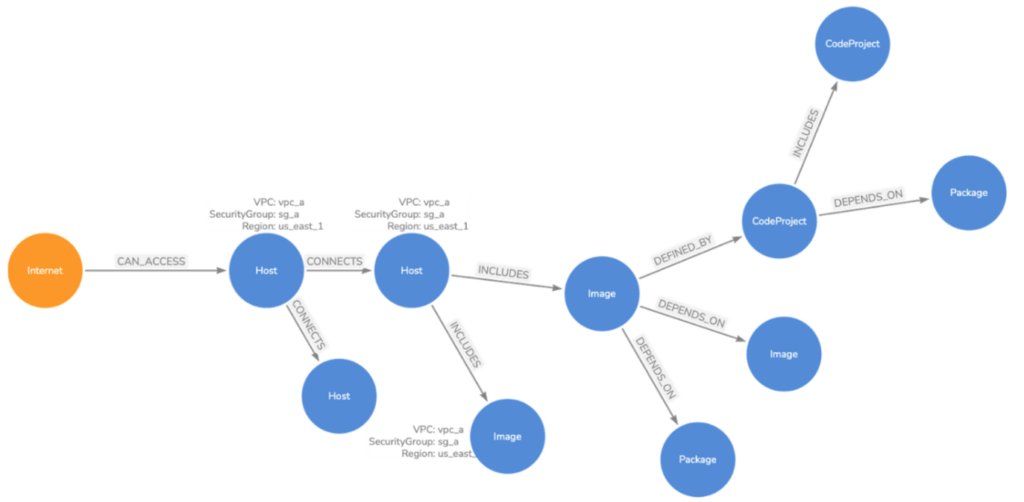
An example
Let’s build out a hypothetical example of how Attack Path Graph works:
- Edge host: Externally facing, a web server delivers our web applications. It’s a standard web server image, running standard tools, and on top of that, our organization’s custom application.
- Inner host: Behind the web server, we have another instance running middleware and analytics. It’s all commercial-grade applications purchased from known vendors.
- Crown jewels: Our back end is a database serving middleware queries to handle our application’s requests, and this database is what we’ll consider our crown jewels.
With this hypothetical setup, an attack path could be something like the following:
- The edge host web server (Linux, Apache) is running our custom application. That application is built on several libraries, including one with a recently discovered vulnerability – called libnowvuln. We’ve identified the risk from libnowvuln to be high. There is a known proof of concept against libnowvuln, but it’s not known to be exploited in the wild…yet.
- The midddleware server is running several applications, one of which is known to be vulnerable to a privilege escalation. The vulnerability scanners rate it as a medium threat, though Vulcan Cyber rates it higher due to its position in the environment. There is no known exploit against the application, but if someone were to compromise another host and gain credentials they could take advantage of the vulnerable app.
- Our database server is reasonably well secured, though there is a known API vulnerability which is rated medium. Again, we rate it higher because it’s on a high-value server.
Our attack path would look something like this:
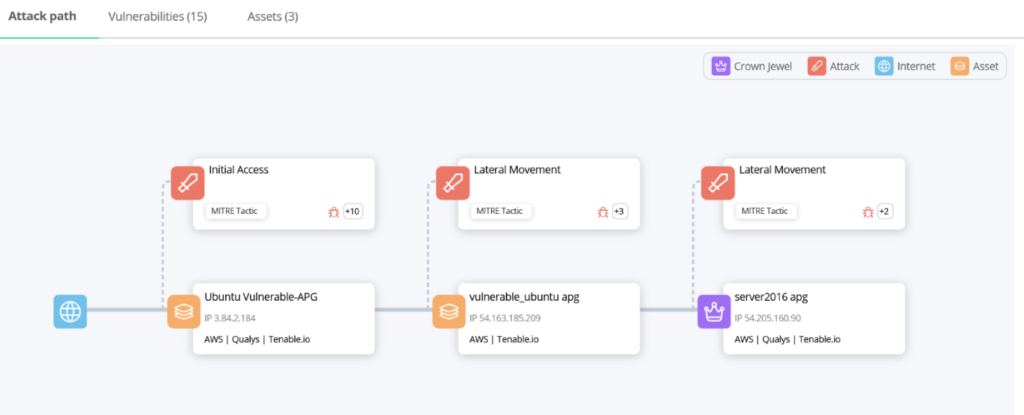
While we have always shown known vulnerabilities in the environment, Attack Path Graph lets us stitch together the potential route an attacker could take from the initial access to the crown jewels. Here, an exploit of the vulnerable library on the edge compromises that host. They can use that to springboard to the middleware host since it’s supposed to communicate more openly with the edge.
The same applies to the last step. If the attacker can compromise the middleware host from the edge, they have a clean shot to the database and the crown jewels.
Attack Path Graph is not showing what has or will happen, but it shows a clear picture of what can happen. While our example was just hypothetical and didn’t dig into the deeper layers of what risk signals Vulcan Cyber is using to map out the environment, identify the threats, and plot them to the graph. It’s not an unrealistic scenario.
To learn more and see Vulcan Cyber Attack Path Graph in action, see our latest webinar and efficiently identify and reduce your organization’s most-critical risk.


