What does complex vulnerability data search look like?
Here at Vulcan Cyber, we provide a platform to first ingest your vulnerability feeds from the various security tools deployed in your organization across the different stacks and teams (VM, application security, cloud operations, etc.). We then correlate the disparate data points, prioritize them, and finally assist you in orchestrating your vulnerability management and remediation efforts.
It is not a surprise to anyone, of course, but one of the primary reasons for collecting data is so that one can search through it, slicing and dicing as required to answer questions you can’t necessarily answer upfront, and analyze it. This lets you make informed decisions accordingly, both ad hoc and in real-time, and offers a more structured, report-based approach. Given the amount of data we ingest at Vulcan Cyber, each data point must be visible and usable, as it indicates a vulnerability in your organization, possibly detected by multiple tools. However, complex vulnerability data search a simple task, even for simple questions.
With many moving parts that work in tandem to ensure the stability, reliability, and availability of the Vulcan Cyber platform itself and of your data, here we take a deeper look at the journey that our engineering team underwent trying to solve the issue of searching across the billions of data points we ingest daily.
TLDR:
With the correct setup, Snowflake can be a great OLTP DB that can support complex queries over hundreds of millions of data points in mere seconds. Read on to learn exactly how our platform leverages Snowflake for better vulnerability data search.
What is search in Vulcan Cyber?
In the Vulcan Cyber platform, you can find search functionality on many screens: vulnerabilities, assets, tags, playbooks, etc. To simplify the complex landscape of the data structures backing all those screens, let’s focus on a few of the main entities Vulcan Cyber ingests from external sources via the user-defined integrations:
-
Assets: hosts, code projects, websites, images, and cloud resources (and more in the future!)
-
Unique vulnerabilities: – aggregated view of the vulnerability underlying the findings across the assets
-
Vulnerability instances: these are sometimes referred to as findings and are essentially the detection of vulnerabilities in assets with a lifecycle of their own (discovery dates, remediation process SLA, fix or exception status, etc.)

Now that the scope of discussion is set, let’s speak to the nature of the problem: what does great search functionality require?
-
Accurate results: This goes without saying for an application in the vulnerability management space.
-
Fast response: While in certain contexts we can accept longer responses (e.g., generating monthly. reports), day-to-day operations become unmanageable if we have to wait after each click in the interface.
-
Flexible querying: this is somewhat vague, but in investigative contexts, you would want to be able to slice and dice the information in various and complex ways (and trying to maximize impact is definitely such a context when prioritizing what vulnerabilities to remediate and how).
While all of these sound desirable, we are, as is often the case with software solutions, faced with another version of “the triangle of optimization,” where you cannot optimize all the goals at the same time. In past versions of Vulcan Cyber, we aimed to focus on the accuracy and flexibility aspects while trying to fetch and serve the results as fast as possible, but as the scale of the data we ingest daily grew the time to get results became less and less acceptable.

Vulnerability data search challenges we ran into
To aid the discussion, let’s approximate the Vulcan Cyber interaction and data flow:

As with many modern web applications, the users interact with a browser-based interface that communicates with a web server backed by a relational database. In addition, there are a number of scheduled tasks that fetch new data and process it.
In our case, we run into orders at a scale of about 1 million assets, 100k unique vulnerabilities, and 150 million vulnerability instances per tenant. These are generally updated daily with fresh data from external sources (such as new discoveries and remediation status) and reflect user actions taken during the day (automated or manual). The ideal response time, even on the most complicated searches over that data, should be under 10 seconds at worst, with most queries aiming to return results in under 5 seconds.
Caching, pre-calculations and paging
One approach that we tried early on was to cache the results. While it is nothing new that caching is a hard problem in software (and the evidence for that is found in years and years of man-hours), in our case, it proved even trickier since there was no realistic way to cache across all the permutations of the available search parameters. This issue was further compounded by a core feature of Vulcan that essentially creates views over overlapping subsets of data, where each needs to be cached individually. This is true both for materialized views in the DB and dedicated caching systems (e.g., Redis).
Another approach was to leverage the fact that the data we show is mostly aggregated, so instead of aggregating the millions of rows on the fly, we added a step to our ingestion pipeline to pre-calculate the data we show for assets and for vulnerabilities in the user interface. This improved the first paint times in the application and to a certain extent, the search times as well, but the unsurprising drawback was that search results that required these pre-computed values to change would bring us back to square one for that specific query.
The root of the issue was that these searches resulted in queries that required very big table joins in our SQL DB and those were simply too hard-hitting for it. We tried a divide-and-conquer approach to split the necessary computations into different queries and then combine the results in code (or even do some of the computations in code directly), but ultimately this could not scale with the amount of data we were handling, even as it required very complex maintenance on the engineering team’s part.
Eventually, we went the route of paging the data (using infinite scrolling behind the scenes) – both for practical reasons, as the user generally didn’t need the whole data set in one big chunk that would otherwise sit idly in the browser’s memory without user attention, while trying to lessen the load on the systems (BE, FE, APIs, etc.). Unfortunately, as the heavy join queries are executed before the relevant page is taken, it serves more to reduce the data on the wire but does not really improve the response times.
DB optimizations
Realistically, on smaller datasets (usually corresponding to small and medium customers), we were well within the defined performance goals; the issues started surfacing when the vulnerability instances started crossing the 100M mark. In such scenarios, on complex queries with big joins, we would be getting waits of up to 1 minute (and, in extreme cases, up to a couple of minutes), rendering the interface unusable for real-world usage.
While we were exploring the data preparation strategies listed above, we were looking into the root of the problem itself—the relational database on which we have built our application. With a lot of internal effort from many developers and with assistance from DBA tools and experts, we managed to implement many tweaks and improvements over time. Ultimately, though, it all came down to the basics: doing a better search requires you to index your data.
We employed many known tricks of the trade (partitioning data, compound indexes, putting data on indexes to short-circuit page fetches, restructuring queries for better cache and page hits, denormalizing to avoid joins, etc.), and while these helped and improved the situation, even all these efforts combined weren’t enough for the larger scales.
In addition, we hit a different kind of roadblock: all these big tables were creating even bigger indexes; in a specific case, a 200G table was keeping 360GB of indexes, which was impossible to efficiently read unless you hit the correct index or reindex in acceptable rates. These sizes also wrought havoc on our auto vacuum tasks in an ever-worsening negative feedback loop, hampering both the search as well as other processes working with the same tables (like processing and updating), and forcing us to do scheduled cleanups during maintenance windows with potential downtime.
As a preventative measure, we even tried splitting databases and throwing bigger databases at the problem (we even hit our cloud provider’s top-tier instances at a certain point) with big chunks dedicated for reserved I/O operations as observed in our monitoring. While it definitely helped to stabilize the operation, it was not a situation we wanted to be in, both from the FinOps standpoint (the DB costs became a major item in our monthly cloud expenses) and from the operational aspect, as we knew that it was mostly a stop-gap for an underlying problem that would continue to haunt us as we worked to add features to the Vulcan platform.
Query isolation: resources and data
An issue that is fundamental to our operations is customer data security and integrity, and this is all the more true when it comes to search, with it being such a core feature of the product.
We have always maintained tight control over this aspect of the system, but we observed that it incurs growing operational costs on our infrastructure and the teams operating it – specifically as it relates to complex queries requiring more resources from the DB, leading to over-utilization and creating contention with other queries running on the same DB instance, or when requiring granular access control to the data (especially regarding row-level security [RLS]).
To address the resource sharing issue, we created over time an ecosystem of tooling, monitoring, and guidelines around DB queries, but as our tenants and data sizes grew, misbehaving queries became a recurring issue – especially when dealing with them in real-time. We always had the basic failsafe of killing long-running queries, as they were suspected of bad code, but tracking execution time alone was not enough. CPU, memory, I/O operations, filesystem, etc. are all shared resources that can lead to bottlenecks in specific scenarios, and those parameters were much harder to separate by the tenant and by query, given our setup. Each such event required an urgent and complex investigation, leading to improvements to code, features, or procedures, but it was usually not an easy task, and lacking proper, fine-grained observability into the underlying layer of our database was a constant challenge.
The aspects of data security and RLS, interestingly enough, were never issues that gave us trouble with regards to customer data, but that was done in code, with strict checks and tests and ORM safeguards, and not relegated to the infrastructure layer, thus never becoming a “transparent” feature and requiring constant maintenance as the requirements evolved.
Limiting feature-set
As a final option, we looked into a drastic re-think of our product requirements and aspirations: Do we really need all these options in search? Is all that flexibility and search complexity actually required by our customers? Do we need to have data aggregated on the fly and change it to reflect the search results?
The unfortunate truth, however, was that with a few exceptions (which we cleaned up and streamlined the UX around), the answer to all these questions was a resounding “yes,” rather, a fortunate truth, as our customers have shown clear and enthusiastic interest in the feature, backed by discussion and our engagement metrics.
Moreover, we actually needed to have it even more complex and fine-grained to be of greater value to more and more incoming customers, each having a varying and complex real-world, mission-critical vulnerability management process that required more flexibility than we were providing. One example would be the long-awaited ability to create nested AND/OR queries like “((cond1 OR cond2) AND cond3 OR cond4)”, which would, in our setup at the time, bring the search to a halt.
All the above issues accumulated over a long time, and while we definitely made a lot of improvements along the way, it was clear we needed a radical change in how we approached the problem.
How did Snowflake help us solve vulnerability data search?
Seeing that we were reaching the limits of the tech stack we were using at the time, we started looking into more drastic changes and solutions that were created to solve the exact problems we were facing. The last resort as far as we were concerned, as it usually is, was to write a custom solution on our own to handle vulnerability data search, but that almost always proves more trouble than it is worth (or anticipated), so we preferred to explore other avenues first.
One potential alternative we were considering was text-based search engines like Elasticsearch and Solr. We have run a few preliminary viability experiments, and while the results were promising (as is often advertised without getting into preference wars), the text-based nature of the search presented a very complex overhead if we wanted to continue offering existing search categories (with the different data types we have) and extend them even more. In particular, date range and logic semantics would have been very complex to translate into text queries.
Moreover, considering the relational nature of the data we were searching over, we would have been forced either to make several separate searches and creatively cross-reference the results in code or flatten the data into hundreds of millions of de-normalized data points with a large amount of data duplicated (requiring lots of storage and compute to index and comb over it).
Given this relational nature of the data, another alternative was exploring columnar DBs, whereby we would be able to work with partially denormalized data while scanning (and fetching) only the columns necessary for a specific query. One of the big players in that space was Snowflake, which we were already familiar with (in fact, Vulcan Cyber Analytics is powered by Snowflake) and had expertise in-house to set up and support the required DBs and ETLs, so this was an enticing candidate. Like many, we were quite familiar with Snowflake’s OLAP capabilities (and we leverage them well even today), but looking into its OLTP capabilities and performance was definitely novel thinking for us and required deeper exploration.
The questions we wanted to answer were:
-
What is the performance of queries we already run on a dataset of similar size?
-
What data changes do we need to support these queries?
-
How long would it take to pull fresh data from Snowflake?
-
Can Snowflake replace our relational database?
-
And critically, how would the pricing of running the search on Snowflake compare to our existing setup (scaled vertically or horizontally)?
We ran ~15 POCs in different configurations (data size and complexity, modes of operations, DB and warehouse setups, etc.) over a few weeks and were quite positively surprised with the results. The performance was much improved (even on huge datasets we managed to hit well under 10 seconds), the queries required almost no change (except the syntactic idiosyncrasies of the SQL dialects vs. how we generate the queries in our ORM), data pulls and updates were well within acceptable ranges, and we were able to scale vertically and horizontally as needed, basically with a push of a button, while addressing the issue of query isolation with transparent and easily managed resource allocation by a query.
Ultimately, we decided not to switch the whole operation to Snowflake, given all the other features in Vulcan Cyber and their needs, but we had no doubts that it would fit our needs—and may still do so in the future. The surprising side-effect we did observe during our testing was that for the other use cases, we could drop almost all the DB indexes we used to search (as well as other auxiliary tables, tricks, and code), improving the performance of other parts in the system; in particular, we shaved 25% of data ingestion times, on average, just from this change alone.
Eventually, the approach we took was keeping ingestion pretty much the same (minus pre-calculation and optimization stages that no longer serve a purpose), then triggering an ETL pipeline to pull the updated data to Snowflake (replacing the previous dataset wholesale), and then route the search requests to a new service that will query Snowflake instead of the relational DB.

Along the way, we utilized a few handy tricks that we’d like to share:
-
Snowflake has a great query explain tool – it helped us to discover places where inefficient joins caused data ballooning (or as Snowflake materials refer to it – “join explosions”), leading us to extract some unnecessary repeated computations to the ETL step.
-
Make sure to use appropriate warehouses for your use case – we have been pleasantly surprised with the performance we can get using small warehouses even on huge datasets. You can have many of them, paid separately, allowing you to separate warehouses by tenant type and avoid contention on pricy resources when smaller ones can do the job. Just make sure to track waits for resources as indicated by Snowflake – if that happens, you might need to increase warehouse size.
-
Remember to separate ETL warehouse from the query warehouse (they usually require different resources, too) – this will lead to much better utilization of the appropriate resources.
-
Try to limit the scope of data needed to refresh in ETL – sometimes only a small subset of the data changes, or only specific tables—and if you refresh only that, the whole process will be faster.
-
Take the time to optimize and remove unneeded flows when you are migrating to the new DB – sometimes what was needed before is simply irrelevant or can be done much more efficiently.
And finally, as part of solving the search in Vulcan Cyber, we decided to take our backlog of requests that used to be hard and clean all of it! We have even created a new framework to talk about search, as part of this effort, and in fact a number of frameworks:
-
We have created a new protocol to describe search criteria – this allowed us to decouple front end from managing the filters and simply generate itself dynamically as more options are added in the backend.
-
We have created a new framework to describe the search request – using the metadata from the search description, we can now construct a search query of any complexity and grouping.
-
We have created a translation framework that can take a generic description of a query and translate it securely into a Snowflake query, while maintaining tenant separation, minimal overhead for performance, and ease of extension for new filters, decoupled from the rest of the application.
All of these deserve posts of their own – but we’ll leave that for future content.
Results & observations
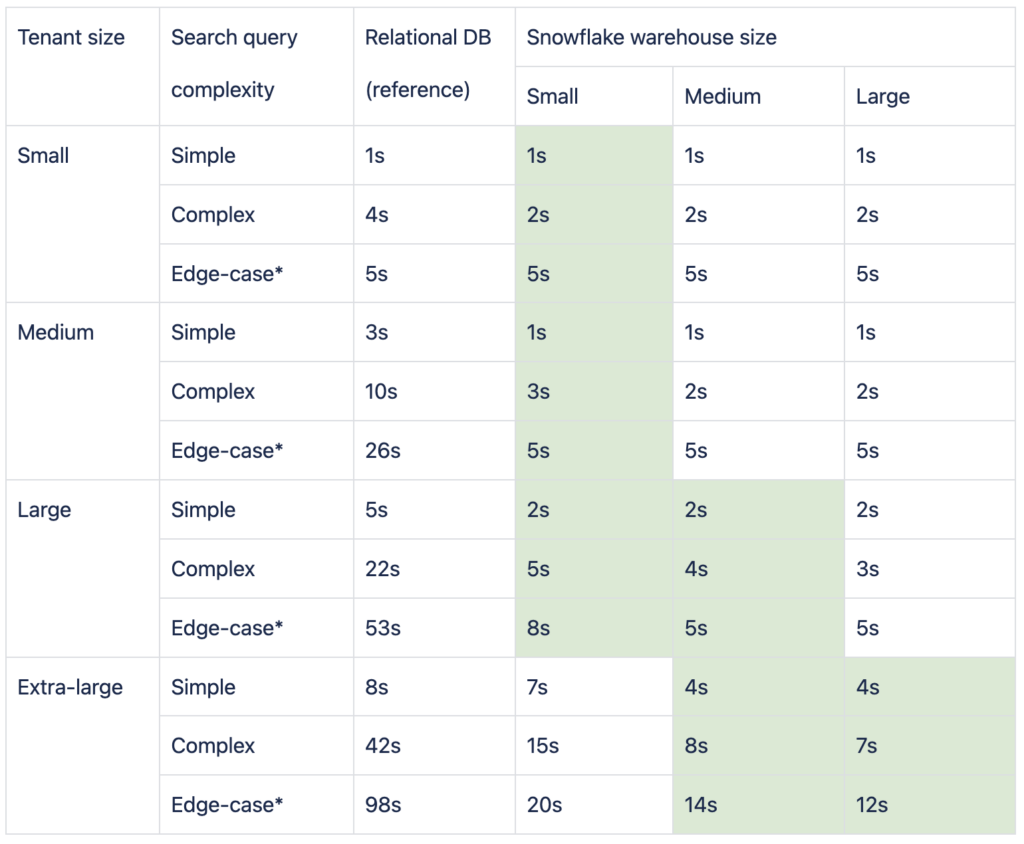
Search query times

Notes:
-
With the relational database, we were hitting unacceptable query times, but with Snowflake, we achieved our goal of under 5s in the complete majority of use cases and under 10s in all but the extreme of edge cases. The crucial step here was using appropriate warehouses in Snowflake to balance performance, utilization, and cost.
-
Edge cases for the relational database were in cases of especially join-heavy queries or those requiring complex where clauses or additional computation in code. In Snowflake, on the other hand, the edge cases were almost exclusively observed when the warehouse was down due to underutilization. This is a balancing act that you can easily fine-tune to your workloads and usage patterns vs. your budget constraints (spread the usage, prevent sleep of warehouse, warm the warehouse on user login, etc.).
-
We have noted that even large tenants work acceptably in small and medium warehouses. After some fine-tuning, we adjusted the default warehouse size to be small, with only select tenants specifically assigned to larger warehouses when the performance or warehouse utilization was beyond the defined limits. This can be easily tracked and monitored from inside the Snowflake UI.
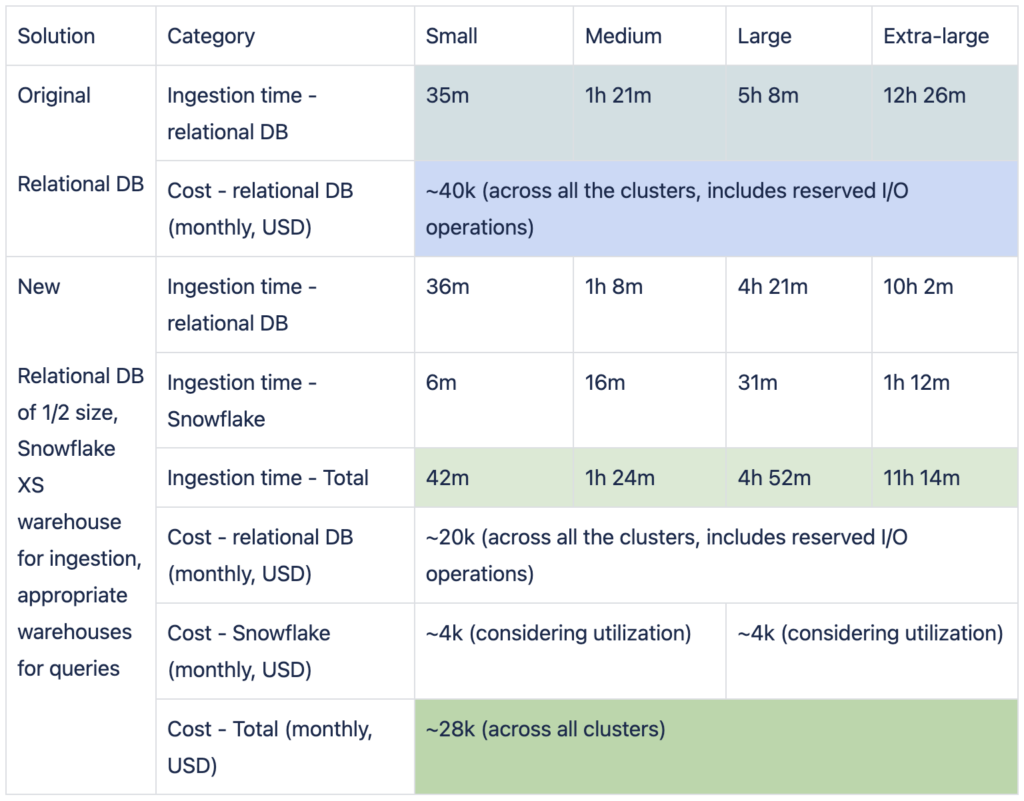
Ingestion times and costs

Notes:
-
Moving the querying to Snowflake not only allowed us to reduce our relational DB database size but also let us remove the unused indexes’ storage sizes and reduce the ingestion times, so even with the addition of the ETL step, the overall times improved (especially for large tenants, where it’s much more critical).
-
Given our cloud provider, it’s relatively complex to calculate DB costs per tenant for the relational DB as the pricing is total over all the tenants sharing the DB instance. Using the split to warehouses in Snowflake allowed us to understand the used resources and the relative cost per tenant. The more use cases we move to Snowflake, the easier it will be to get this granularity.
Future development
We have many things planned from here and many features in store:
-
Integrate the new search across all of Vulcan Cyber, both on user-facing screens and in behind-the-scenes processes.
-
Introduce VQL (Vulcan Query Language) to support power users and more flexible API use.
-
Monitor query performance and optimize FinOps as more and more use cases leverage Snowflake and de-prioritize the relational database.
Final thoughts: complex vulnerability data search
All in all, our solution to handle enterprise-level vulnerability data search was to add an ETL step to pull data from the relational database after ingestion, prepare it for consumption directly from Snowflake, and route the search queries to Snowflake using a new and improved complex query generation framework.
You can see the results of the effort, proving the viability and value of Snowflake for OLTP workflows:
-
~50% reduction in query times in simple queries and ~80% in complex queries and edge cases (those are especially noticeable).
-
~10% decrease in end-to-end ingestion times for large tenants, even with the additional ETL step.
-
~30% decrease in operational costs, even with adding another DB.
And, finally, if you take just a single insight from our journey, let it be this:
If you allow yourself to look at tools you already use in a new light, solving old problems can transform your entire organization. Snowflake certainly did that for us.
Next steps
Efficient vulnerability data search is only one step of the vulnerability management lifecycle. Managing and mitigating cyber risk requires efforts from the entire organization, with the security team acting proactively to lead the charge.
Own and mitigate risk across your entire attack surface with a unified solution. Get your personalized demo of Vulcan Cyber®.


